
Introduction
%matplotlib inline
import networkx as nx
import leveldiagram as ld
To begin, the system is defined using a directional graph, provided by the networkx.DiGraph class. The nodes of this graph represent the levels, the edges represent the desired couplings.
Passing a simple graph to the base level diagram constructor LD will produce a passable output for simple visualization.
nodes = (0,1,2)
edges = ((0,1),(1,2))
graph = nx.DiGraph()
graph.add_nodes_from(nodes)
graph.add_edges_from(edges)
d = ld.LD(graph)
d.draw()
d.fig.savefig('basic_example.png', bbox_inches='tight', dpi=150)

In keeping with peak matplotlib form, getting something that looks nicer requires applying custom configuration settings that control many of the aspects of the diagram.
Gloabl settings can be controlled by passing in keyword argument dictionaries to the constructor.
d = ld.LD(graph, coupling_defaults = {'arrowsize':0.2,'lw':3})
d.draw()

NetworkX graphs take an internal structure of nested dictionaries. Leveldiagram utilizes this to provide keyword argument control over each element in the graph.
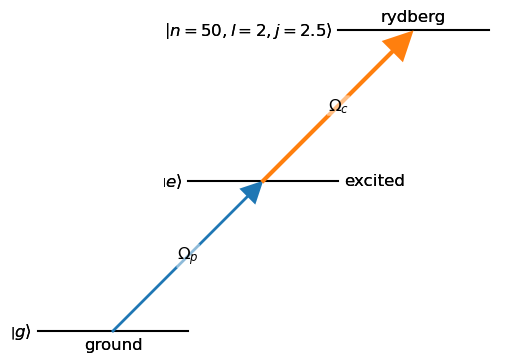
from collections import namedtuple
r_state = namedtuple('r_state', ['n','l','j'])
g = 'g'
e = 'e'
r = r_state(50, 2, 2.5)
nodes = ((g,{'bottom_text':'ground'}),
         (e,{'right_text':'excited'}),
         (r,{'top_text':'rydberg'}))
edges = ((g,e, {'label':'$\\Omega_p$', 'lw':2}),
         (e,r, {'label':'$\\Omega_c$','lw':3, 'arrowsize':0.2}))
graph = nx.DiGraph()
graph.add_nodes_from(nodes)
graph.add_edges_from(edges)
d = ld.LD(graph)
d.draw()
d.fig.savefig('intermediate_example.png', bbox_inches='tight', dpi=150)
More detailed examples of element configuration and diagram creation, including embedding a diagram in a larger figure, are shown in the Example Notebooks.
ld.about()
        leveldiagram
    ====================

leveldiagram Version: 0.3.2.dev1

        Dependencies
    ====================

Python Version:       3.10.13
NumPy Version:        1.26.0
Matplotlib Version:   3.7.2
NetworkX Version:     3.1