Detailed API Documentation
Documention of the classes and methods provided by leveldiagram
Level Diagram Constructors
- class leveldiagram.LD(graph, ax=None, default_label='left_text', level_defaults=None, coupling_defaults=None, wavy_defaults=None, deflection_defaults=None, use_ld_kw=False)[source]
Basic Level Diagram drawing class.
This class is used to draw a level diagram based on a provided Directional Graph. The nodes of this graph define the energy levels, the edges define the couplings.
Note
In keeping with the finest matplotlib traditions, default options and behavior will produce a reasonable output from a graph. To get more refined diagrams, global options can be set by passing keyword argument dictionaries to the constructor. Options per level or coupling can be set by setting keyword arguments in the dictionaries of the nodes and edges of the graph.
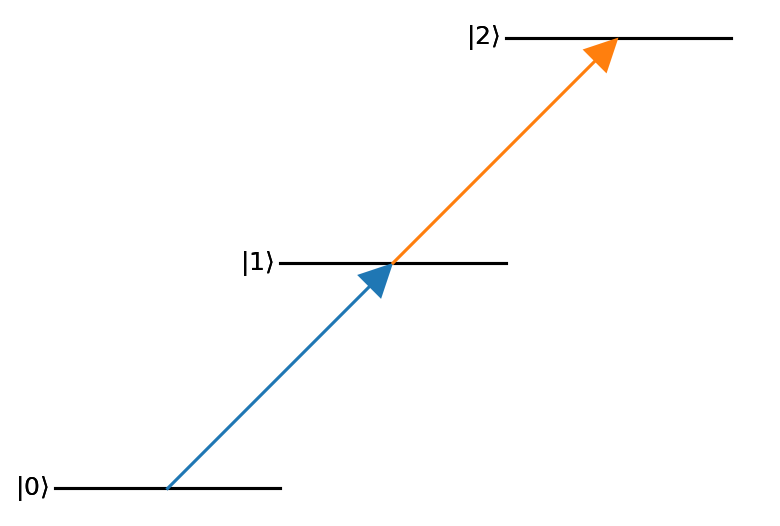
Examples
>>> nodes = (0,1,2)
>>> edges = ((0,1), (1,2))
>>> graph = nx.DiGraph()
>>> graph.add_nodes_from(nodes)
>>> graph.add_edges_from(edges)
>>> d = ld.LD(graph)
>>> d.draw()
- Parameters:
graph (networkx.DiGraph) –
Graph object that defines the system to diagram
Beyond the arguments provided to the
Couplingartist primitive, each coupling plotted byLDcan also take the following parameters (which are defined as edge attributes on the graph).hidden: bool - Tells
LDto ignore this couplingstart_anchor: str or 2-element tuple - Controls the start anchor point
stop_anchor: str or 2-element tuple - Controls the stop anchor point
detuning: float - How much to detune the coupling from the transition by. Defined in x-coordinate units.
wavy: bool - Make coupling arrow a sine wave. Uses default options if wavy specific options not provided.
deflect: bool - Make coupling a deflected, circular coupling. Uses default options if deflect specific options not provided.
ax (matplotlib.axes.Axes, optional) – Axes to add the diagram to. If None, creates a new figure and axes. Default is None.
default_label (str, optional) – Sets which text label direction to use for default labelling, which is the node index inside a key. Valid options are
'left_text','right_text','top_text','bottom_text'. If ‘none’, no default labels are not generated.level_defaults (dict, optional) –
EnergyLeveldefault values for whole diagram. Provided values override class defaults. If None, use class defaults.coupling_defaults (dict, optional) –
Couplingdefault values for whole diagram. Provided values override class defaults. If None, use class defaults.wavy_defaults (dict, optional) – Wavy specific
Couplingdefault values for whole diagram. Provided values override class defaults. If None, use class defaults.deflection_defaults (dict, optional) – Deflection specific
Couplingdefault values for whole diagram. Provided values override class defaults. If None, use class defaults.use_ld_kw (bool) –
- _coupling_defaults = {'arrowsize': 0.15, 'label_kw': {'fontsize': 'large'}}
Coupling default parameters dictionary
- _deflection_defaults = {'deflection': 0.25}
Default parameters for a deflection
- _level_defaults = {'color': 'k', 'text_kw': {'fontsize': 'large'}, 'width': 1}
EnergyLevel default parameters dictionary
- _wavy_defaults = {'halfperiod': 0.1, 'waveamp': 0.05}
Default parameters for a wavy coupling
- draw()[source]
Add artists to the figure.
This calls
matplotlib.axes.Axes.autoscale_view()to ensure plot ranges are increased to account for objects.It may be necessary to increase plot margins to handle labels near edges of the plot.
- generate_couplings()[source]
Creates the Coupling and WavyCoupling artisits from the graph edges.
They are saved to the
couplingsdictionary.
- generate_levels()[source]
Creates the EnergyLevel artists from the graph nodes.
They are saved to the
levelsdictionary.
- levels: Dict[int, EnergyLevel]
Stores levels to be drawn
Artist Primitives
Customized matplotlib artist primitives
- class leveldiagram.artists.Coupling(start, stop, arrowsize, deflection=0.0, waveamp=0.0, halfperiod=0, arrowratio=1, tail=False, arrow_kw=None, label='', label_offset='center', label_rot=False, label_flip=False, label_kw=None, **kwargs)[source]
Bases:
Line2DCoupling artist for showing couplings between levels.
This artist is a conglomeration of artists.
Sufficient methods are overridden from the base Line2D class to ensure the other artists are rendered whenever the main artist is rendered.
- Parameters:
start (2-element collection) – Coupling start location in data coordinates
stop (2-element collection) – Coupling end location in data coordinates
arrowsize (float) – Size of arrowheads in x-data coordinates
deflection (float, optional) – Amount to bend the center of the coupling arrow away from linear. Defined in y-coordintes. Default is 0 or no deflection.
waveamp (float, optional) – Amplitude of sine wave modulation of the coupling arrow. Defined in y-coordinates. Default is 0 or no waviness.
halfperiod (float, optional) – Length of half-period of sine modulation. Defined in x-coordinates. Both
waveampandperiodmust be non-zero to get modulation. Default is 0 or no waviness.arrowratio (float, optional) – Aspect ratio of the arrowhead. Default is 1 for equal aspect ratio.
tail (bool, optional) – Whether to draw an identical arrowhead at the coupling base. Default is False.
arrow_kw (dict, optional) – Dictionary of keyword arguments to pass to
matplotlib.patches.Polygonconstructor. Note that keyword arguments provided to this function will clobber identical keys provided here.label (str, optional) – Label string to apply to the coupling. Default is no label.
label_offset (str, optional) – Offset direction for the label. Options are
'center','left', and'right'. Default is center of the coupling line.label_rot (bool, optional) – Label is justified along the coupling arrow axis if True. Default is False, so label is oriented along x-axis always.
label_flip (bool, optional) – Apply a 180 degree rotation to the label. Default is False.
label_kw (dict, optional) – Dictionary of keyword arguments to pass to the
matplotlib.text.Textconstructor.kwargs – Optional keyword arguments passed to the
matplotlib.lines.Line2Dconstructor and thematplotlib.patches.Polygonconstructor for the arrowhead. Note that'color'will be automatically changed to'facecolor'for the arrowhead to avoid extra lines.
- draw(renderer)[source]
Draw the Artist (and its children) using the given renderer.
This has no effect if the artist is not visible (
.Artist.get_visiblereturns False).- Parameters:
renderer (
~matplotlib.backend_bases.RendererBasesubclass.) –
Notes
This method is overridden in the Artist subclasses.
- init_arrowheads(**kwargs)[source]
Creates the arrowhead(s) for the coupling as matplotlib polygon objects.
- Parameters:
kwargs – Optional keyword arguments to pass to the
matplotlib.patches.Polygonconstructor.
- init_label(label, label_offset, label_rot, label_flip, **label_kw)[source]
Creates the coupling label text object.
- Parameters:
label (str) – Label string to apply to the coupling.
label_offset (str) – Offset direction for the label. Options are
'center','left', and'right'.label_rot (bool) – Label will be justified along the coupling arrow axis if True.
label_flip (bool) – Apply a 180 degree rotation to the label.
label_kw – Keyword arguments to pass to the
matplotlib.text.Textconstructor.
- init_path()[source]
Calculates the desired path for the line of the coupling.
The returned path is a line relative to the x-axis of the correct length. Transforms are used to move and rotate this path to the end location. This method of making the couplings is a little convoluted, but it allows for simple definition of very general paths (line sine waves) without distortions.
- class leveldiagram.artists.EnergyLevel(energy, xpos, width, right_text='', left_text='', top_text='', bottom_text='', text_kw=None, **kwargs)[source]
Bases:
Line2DEnergy level artist.
This object also implements a number of potential Text artists for labelling. It also includes helper methods for getting the exact coordinates of anchor points for connected coupling arrows and the like.
- Parameters:
energy (float) – y-axis position of the level
xpos (float) – x-axis position of the level
width (float) – Width of the level line, in units of the x-axis
right_text (str, optional) – Text to put to the right of the level
left_text (str, optional) – Text to put to the left of the level
top_text (str, optional) – Text to put above the level
bottom_text (str, optional) – Text to put below the level
text_kw (dict, optional) – Dictionary of keyword-arguments passed to
matplotlib.text.Textkwargs – Passed to the
matplotlib.lines.Line2Dconstructor
- draw(renderer)[source]
Draw the Artist (and its children) using the given renderer.
This has no effect if the artist is not visible (
.Artist.get_visiblereturns False).- Parameters:
renderer (
~matplotlib.backend_bases.RendererBasesubclass.) –
Notes
This method is overridden in the Artist subclasses.
- get_anchor(loc='center')[source]
Returns an anchor on the level in plot coordinates.
- Parameters:
loc (str or collection of 2 elements) – What reference point to return.
'center','left','right'gives those points of the level. A 2-element iterable is interpreted as offsets from the center location.- Raises:
TypeError – If
locis not accepted string or a 2-element iterable.- Return type:
- get_center()[source]
Returns coordinates of the center of the level line.
- Returns:
x,y coordinates
- Return type:
- get_left()[source]
Returns coordinates of the left of the level line.
- Returns:
x,y coordinates
- Return type:
- get_right()[source]
Returns coordinates of the right of the level line.
- Returns:
x,y coordinates
- Return type:
- set_data(x, y)[source]
Set the x and y data.
- Parameters:
*args ((2, N) array or two 1D arrays) –
See also
set_xdata,set_ydata
Utilities
Miscellaneous utility functions
- leveldiagram.utils.bra_str(s)[source]
Put a bra around the string in matplotlib.
If input is a Sequence, but not a str or dict, the string representation will only show the container contents. For a tuple
(1,2), the resulting bra will have the form \(\langle1,2|\).
- leveldiagram.utils.deep_update(mapping, *updating_mappings)[source]
Helper function to update nested dictionaries.
Lifted from pydantic